For our free coronavirus pandemic coverage, learn more here.
A total of 97 postcodes throughout Victoria currently have at least one active COVID-19 case among residents, up from 76 postcodes last Tuesday.
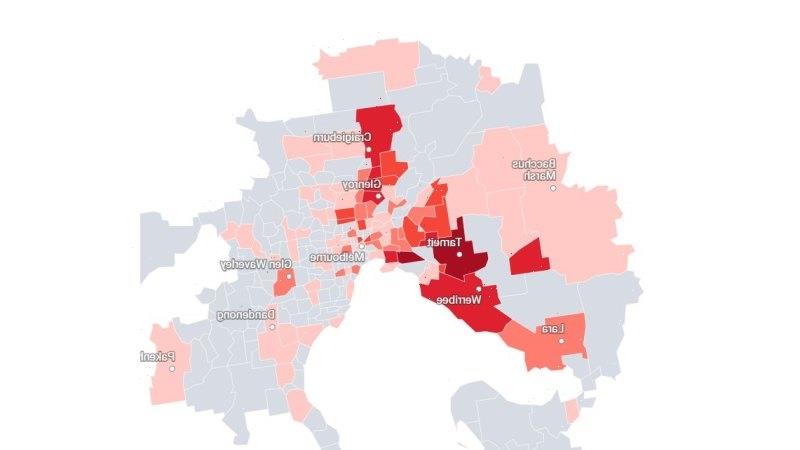
The maps below show which postcodes in the Melbourne region have at least one active case, as well as active case numbers for all of Victoria:
If you select an area on the map, you can also view its current active case rate and see whether it’s changed over the past week. You can also use the controls on the right of the map to zoom in on your chosen postcode.
Of the 841 active cases statewide, 710 are in the metropolitan Melbourne region and 125 are in rural or regional areas.
The Department of Health data shows there are also five active cases statewide among returned travellers in hotel quarantine and one active case for which the postcode of residence is not yet known. These cases do not show up on the map.
If you would like to view the data on active cases in table format, the data has been included in a searchable database below:
Postcode 3029 (Hoppers Crossing, Tarneit and Truganina) has the most active cases with 111, an increase of 20 active cases compared to one week ago.
And postcode 3025 (Altona North) has the second-highest active case tally with 94, an increase of 26 active cases over the past seven days.
You can see how total active case numbers have tracked in your area over the past three weeks using the graphic below. If you type your postcode into the search box, the graph will show the number of known active cases there as of each day since August 17.
But of the five postcodes with the most active cases, two are in regional Victoria. Postcode 3630 (Branditt, Caniambo, Colliver, Dunkirk, Shepparton and Shepparton South) has 55 active cases and 3631 (Arcadia, Arcadia South, Cosgrove, Cosgrove South, Grahamvale, Karramomus, Kialla, Kialla East, Kialla West, Lemnos, Orrvale, Pine Lodge, Shepparton East and Shepparton North) has 44.
Of the 125 active cases in regional Victoria, 110 are in the Shepparton region. That’s an increase from the 44 active cases in that area as of last Tuesday:
Vaccination rates by local government area
Late last week, the federal health department released data breaking down COVID-19 vaccination rates by council area.
The figures, for Victoria’s 79 local government areas, provide the most detailed local view yet on the vaccine rollout.
Using the maps below, you can find the percentage of those aged 15 and above in your area that had received both doses of a COVID-19 vaccine as of August 27:
And this map zooms out to show all of Victoria, from which it is possible to see the vaccination rates in rural and regional municipalities:
You can use the controls in the bottom-right corner of the maps to zoom into your area. If you click or tap your local government area, an info box will appear that breaks down the percentage of the eligible population that have received one vaccine dose, as well as the percentage that is fully vaccinated against the virus.
Hume, in Melbourne’s north, recorded the lowest percentage of its population aged 15 and over fully vaccinated
As of August 27, just over 22.4 per cent of people in Hume aged 15 and above had received both vaccine shots, compared with 33.3 per cent of the eligible population statewide.
And 40.8 per cent of Hume’s eligible population had received one vaccine dose, compared with 54.3 per cent of the eligible population statewide. But this may in part be due to Hume having a population that skews younger than that of the state more generally, so the federal government’s vaccine rollout has meant this group until recently has had little access to jabs.
The Hume area currently has the fourth highest active case rate in Victoria, at 45 cases per 100,000 residents:
Of all municipalities statewide, Queenscliffe, on the Bellarine Peninsula, has the highest percentage of its 15+ population fully vaccinated, at 64 per cent. But it’s worth noting that this is also the state’s least populated local government area and that its population skews older than that of the rest of the state.
The data on vaccination rates by local government area will be released on a weekly basis by the federal health department, and we plan to start including this data in our vaccine tracker dashboard.
Stay across the most crucial developments related to the pandemic with the Coronavirus Update. Sign up to receive the weekly newsletter.
Most Viewed in National
From our partners
Source: Read Full Article